.png)
Hi, Community!
In this article, I will introduce Python Streamlit Web Framework.
Below, you can find the topics we will cover:
- 1-Introduction to Streamlit Web Framework
- 2-Installation of Streamlit module
- 3-Running Streamlit Application
- 4-Streamlit Basic commands
- 5-Display multimedia
- 6-Input widgets
- 7-Display progress and status
- 8-Sidebar and container
- 9-Data Visualization
- 10-Display a DataFrame
So, let's start with the first topic.
1-Introduction to Python Streamlit Web Framework
Streamlit is an open-source Python framework that allows data scientists and machine learning engineers to create interactive web applications quickly and easily.
With its simple syntax and effortless integration with popular data science libraries, Streamlit has become the front-runner for prototyping and sharing projects.
For more details please view Streamit Documentations
.png)
2-Installation of Streamlit module
Before we start building our Streamlit Web Application, we need to install the module using the pip package installer.
To install Streamlit, run the following command:
pip install streamlit
.png)
Below there is the command to test the installation:
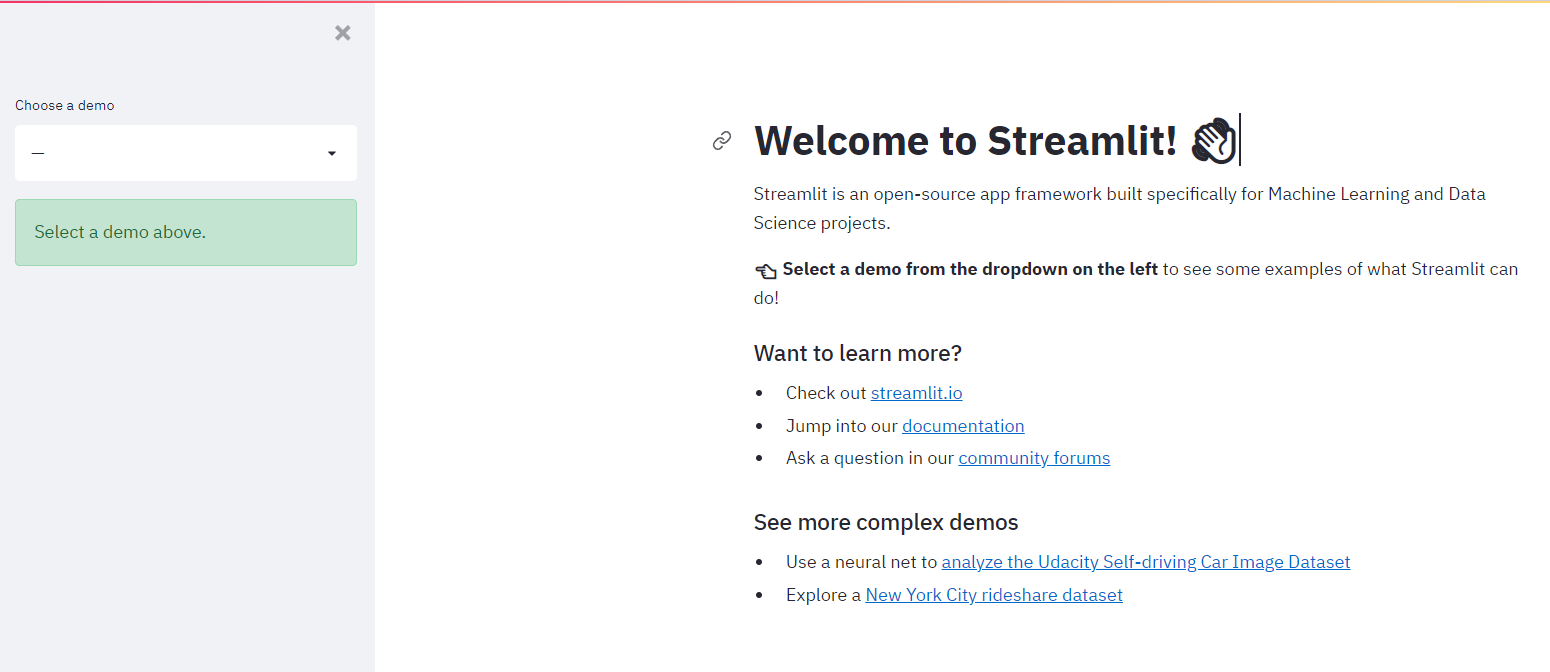
streamlit hello
.png)
When you type the command mentioned above in the terminal, the following page should open automatically:
3-Running Streamlit Application
Working with Streamlit is straightforward. First, you sprinkle a few Streamlit commands into a normal Python script, then you run it with streamlit run:
streamlit run your_python_file.py
As soon as you run the script, a local Streamlit server will spin up and your app will open in a new tab in your default web browser. Please note that the app is your canvas, where you will draw charts, texts, widgets, tables, and more.
Another way of running Streamlit is doing so as a Python module. This can come in handy when configuring an IDE, e.g., PyCharm to work with Streamlit:
python -m streamlit run your_python_file.py
Remember to save the source file whenever you wish to update your app. When you do so, Streamlit detects a change if any, and asks you whether you want to rerun your app. Select "Always rerun" at the top-right of your screen to automatically update your app each time you modify its source code. It will allow you to work in a fast interactive loop: you type some code, save it, try it out live, then type some more code, save it, try it out, and so on until you are happy with the results. This tight loop between coding and viewing results live is one of the ways Streamlit makes your life easier.
4-Streamlit Basic commands
Display texts with Streamlit
st.write(): This function adds anything from formatted strings to charts in Matplotlib figures, Altair charts, Plotly figures, data frames, Keras models, and others to a web app.
Let's create main.py file below:
import streamlit as st

st.write("Hello ,let's learn how to build a streamlit app together")
Run the main.py file by operating the following command:
streamlit run main.py
.png)
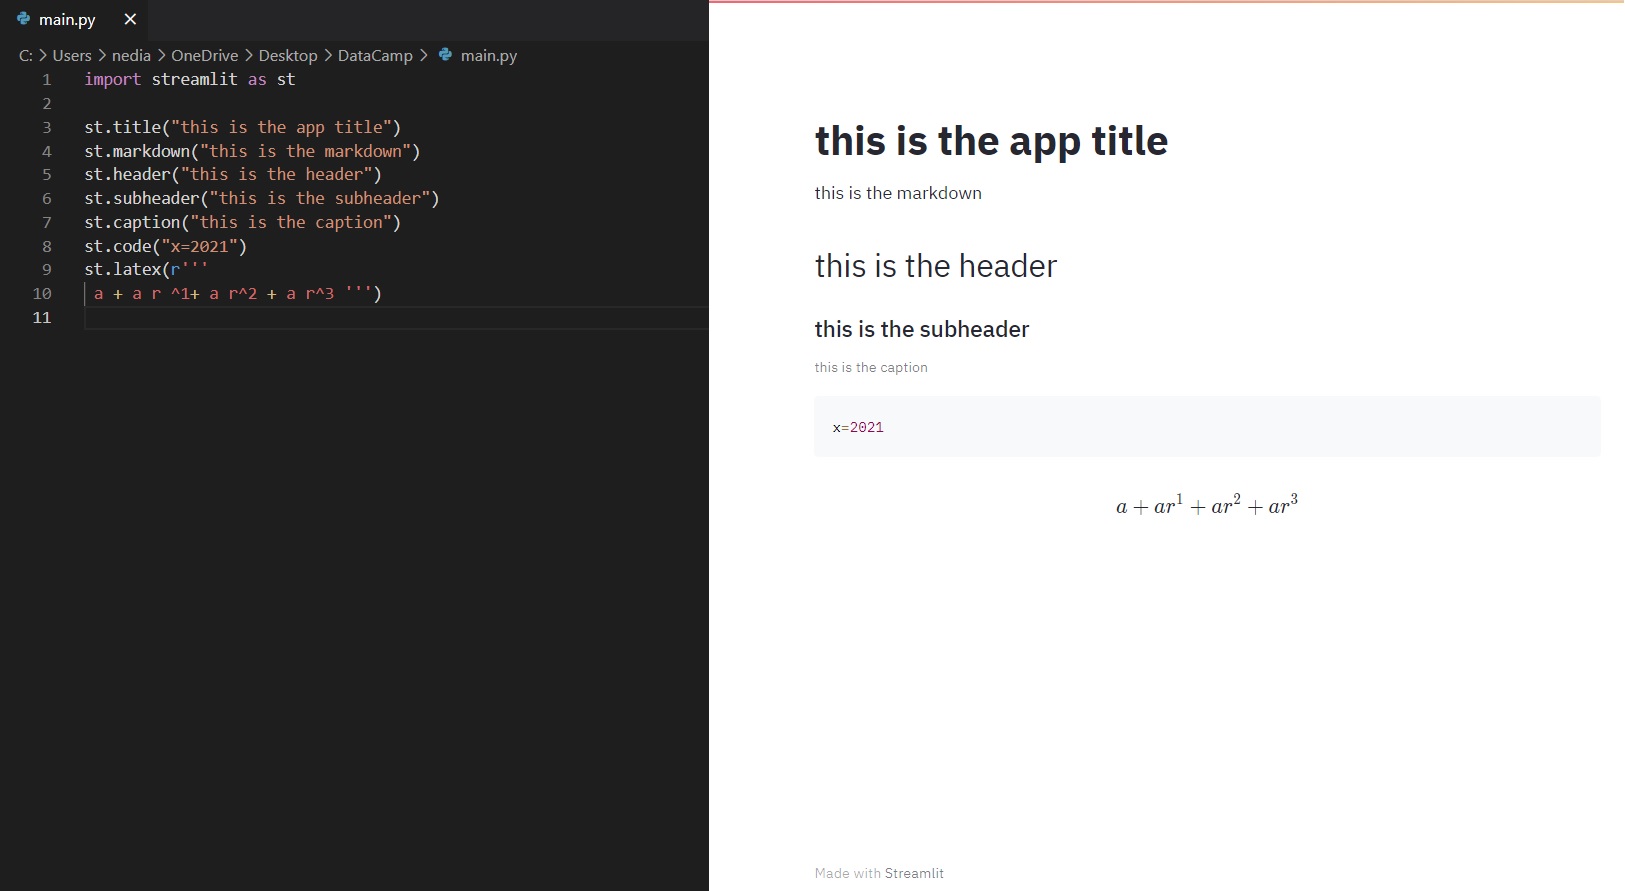
st.title(): This function allows you to add the title to the app.
st.header(): This function is used to assign the header of a section.
st.markdown(): This function is utilized to set a markdown of a section.
st.subheader(): This function is employed to set the sub-header of a section.
st.caption(): This function is used to write captions.
st.code(): This function is utilized to set a code.
st.latex(): This function displays mathematical expressions formatted as LaTeX.
import streamlit as st

st.title("This is the app title")
st.header("This is the header")
st.markdown("This is the markdown")
st.subheader("This is the subheader")
st.caption("This is the caption")
st.code("x = 2021")
st.latex(r''' a+a r^1+a r^2+a r^3 ''')
5-Display multimedia
Below we listed some functions to display images, videos, and audio files.
st.image(): This function is employed to depict an image.
st.audio(): This function is utilized to display an audio.
st.video(): This function is used to show a video.
import streamlit as st

st.subheader("Image :")
st.image("kid.jpg")

st.subheader("Audio :")
st.audio("audio.mp3")

st.subheader("Video :")
st.video("video.mp4")
.png)
6-Input widgets
Widgets are the most significant user interface components. Streamlit has various widgets that allow you to build interactivity directly into your apps with buttons, sliders, text inputs, and more.
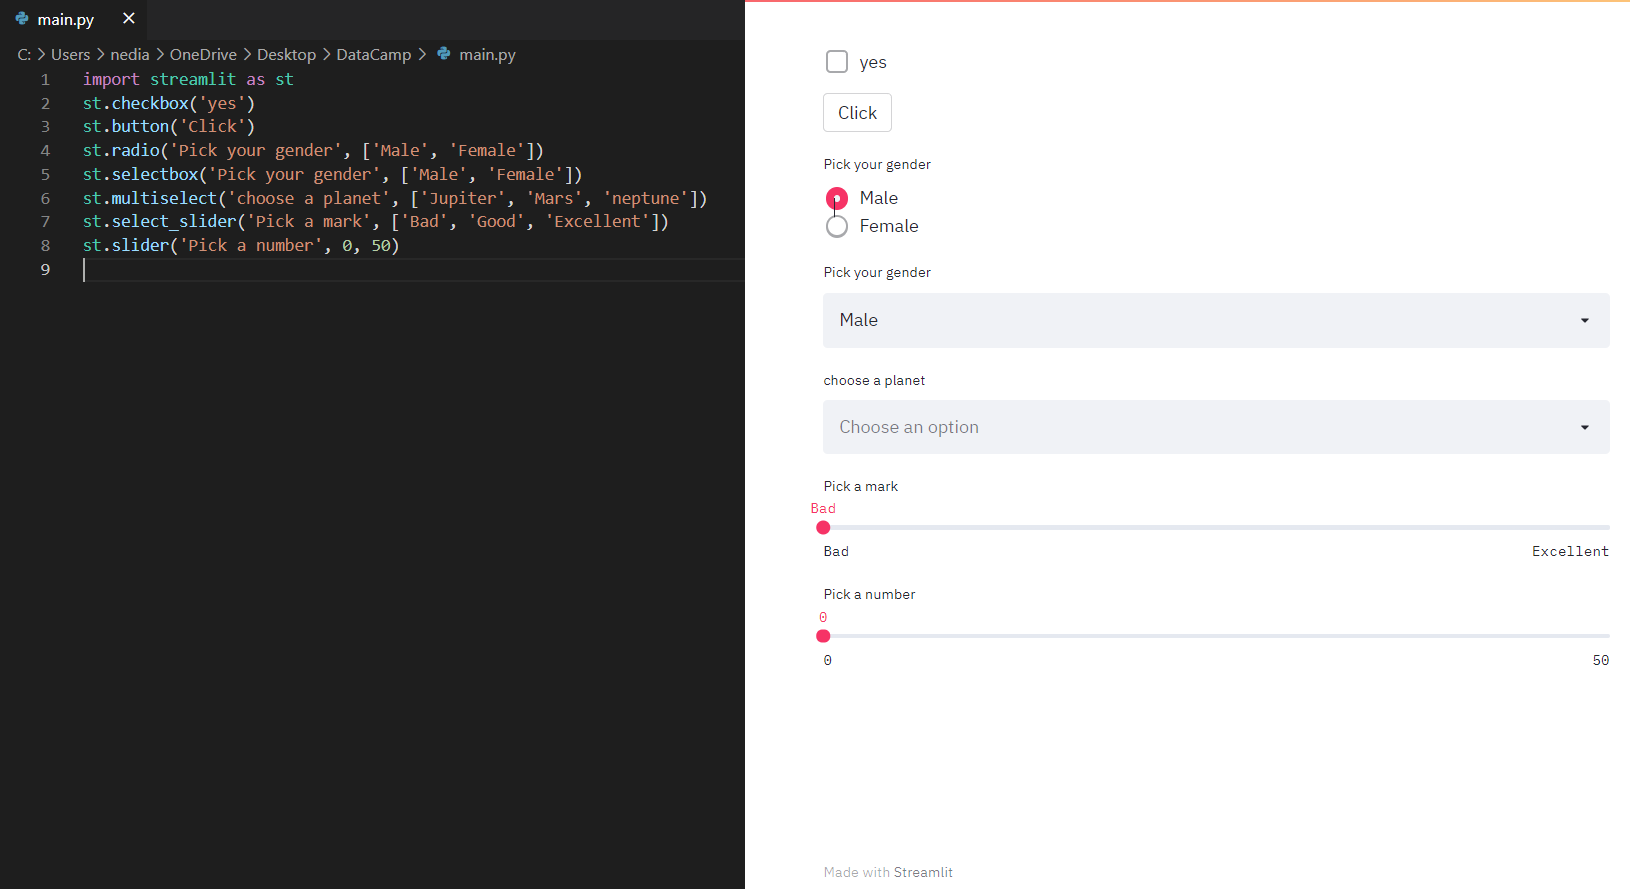
st.checkbox(): This function returns a Boolean value. When the box is checked, it returns a True value. Otherwise, it sends back a False value.
st.button(): This function is used to display a button widget.
st.radio(): This function exhibits a radio button widget.
st.selectbox(): This function is utilized to demonstrate a select widget.
st.multiselect(): This function is used to display a multi select widget.
st.select_slider(): This function is used to display a select slider widget.
st.slider(): This function is used to display a slider widget.
import streamlit as st

st.checkbox('Yes')
st.button('Click Me')
st.radio('Pick your gender', ['Male', 'Female'])
st.selectbox('Pick a fruit', ['Apple', 'Banana', 'Orange'])
st.multiselect('Choose a planet', ['Jupiter', 'Mars', 'Neptune'])
st.select_slider('Pick a mark', ['Bad', 'Good', 'Excellent'])
st.slider('Pick a number', 0, 50)
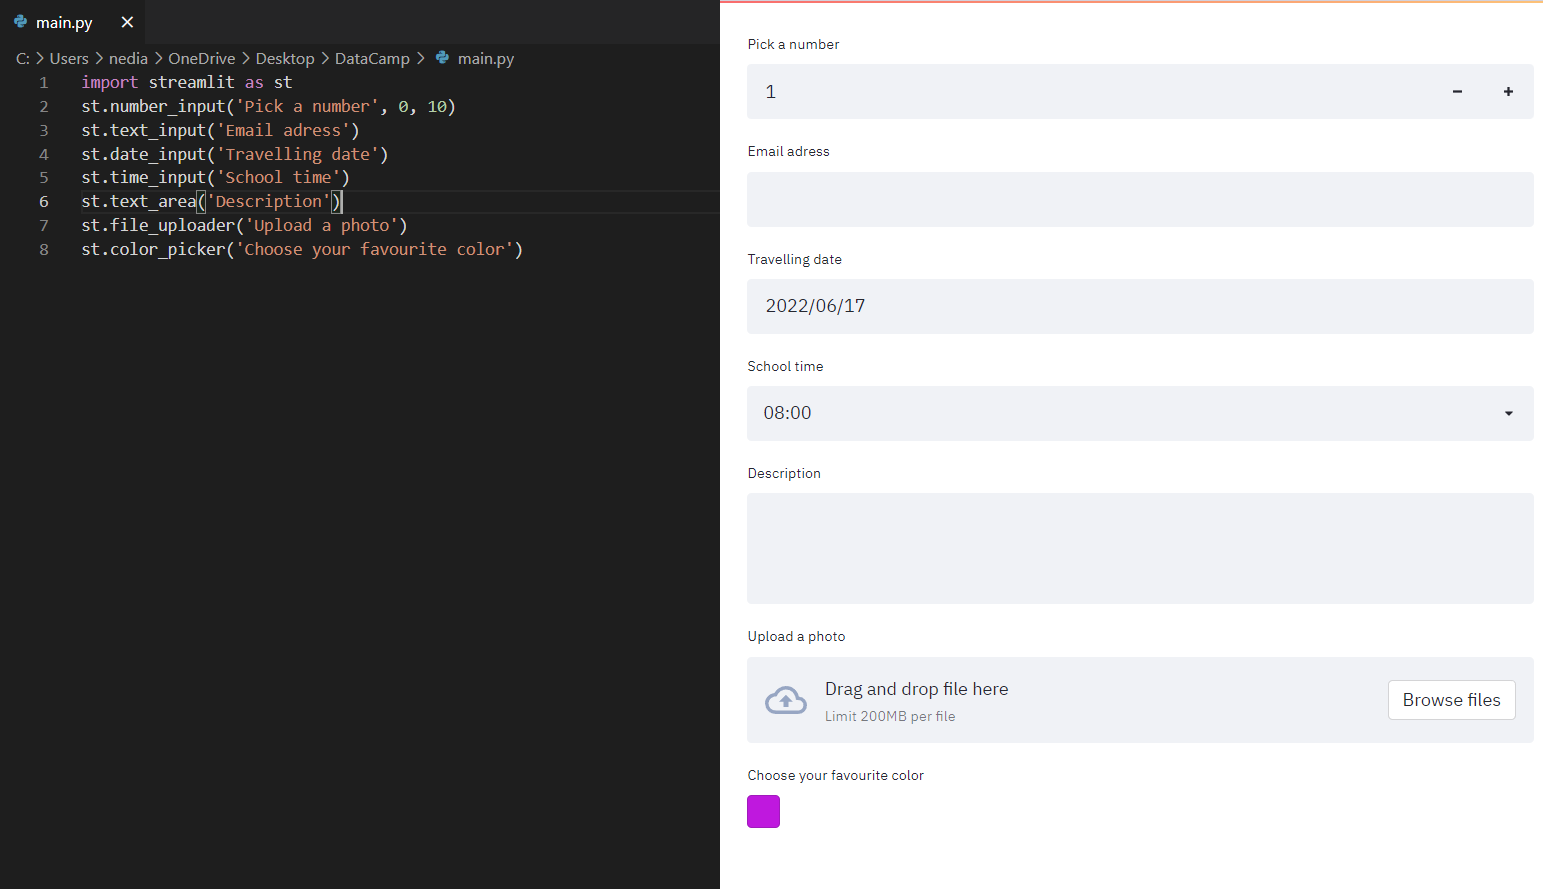
st.number_input(): This function displays a numeric input widget.
st.text_input(): This function exhibits a text input widget.
st.date_input(): This function reveals a date input widget to choose a date.
st.time_input(): This function exposes a time input widget to select a time.
st.text_area(): This function shows a text input widget with more than a line of text.
st.file_uploader(): This function is operated to demonstrate a file uploader widget.
st.color_picker(): This function is operated to demonstrate a file uploader widget.
import streamlit as st

st.number_input('Pick a number', 0, 10)
st.text_input('Email address')
st.date_input('Traveling date')
st.time_input('School time')
st.text_area('Description')
st.file_uploader('Upload a photo')
st.color_picker('Choose your favorite color')
7-Display progress and status
At this point, we will explain how to add a progress bar and such status messages as error and success to our app.
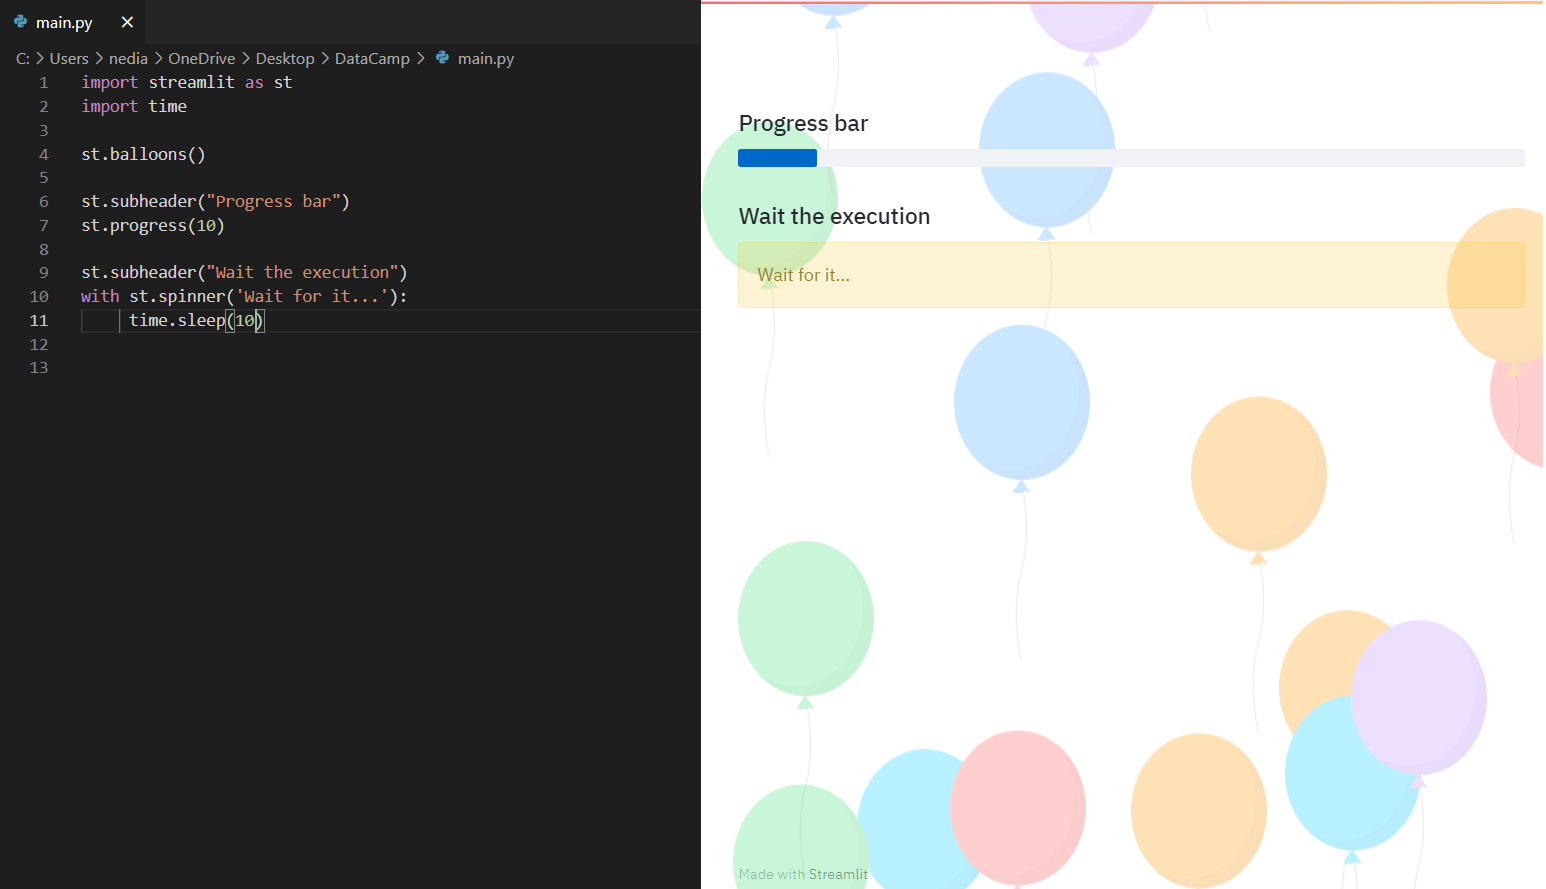
st.balloons(): This function is used to display balloons for celebration.
st.progress(): This function is utilized to show a progress bar.
st.spinner(): This function demonstrates a temporary waiting message during execution.
import streamlit as st
import time
st.balloons()
st.subheader("Progress bar")
st.progress(10)
st.subheader("Wait the execution")
with st.spinner('Wait for it...'):
time.sleep(10)
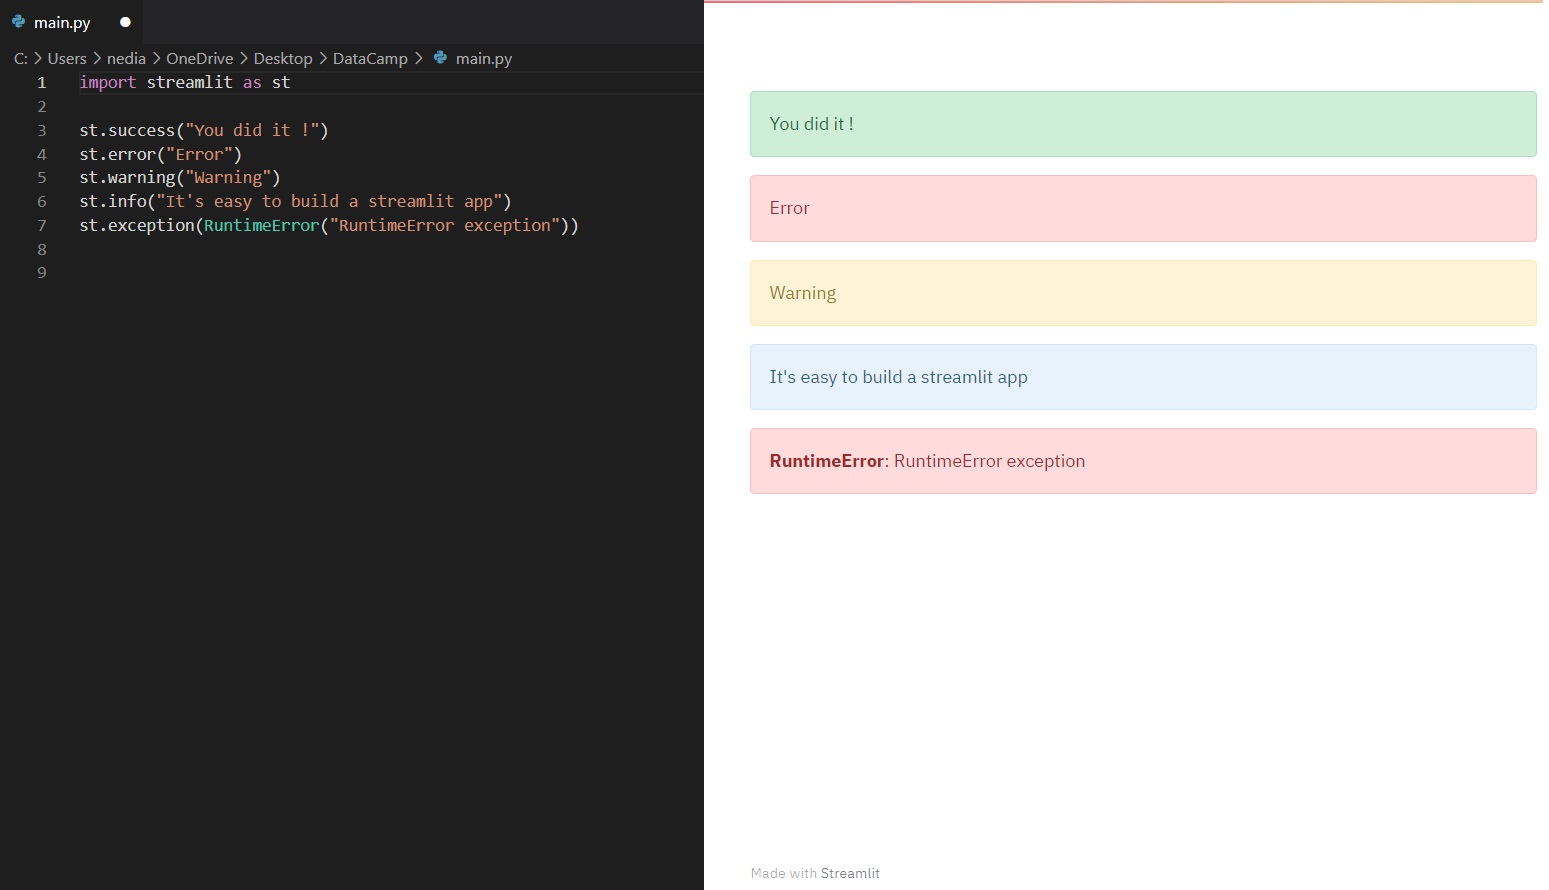
st.success(): This function exhibits a success message.
st.error(): This function is used to demonstrate an error message.
st.warning(): This function is utilized to display a warning message.
st.info(): This function reveals an informational message.
st.exception(): This function is operated to show an exception message.
import streamlit as st

st.success("You did it!")
st.error("Error occurred")
st.warning("This is a warning")
st.info("It's easy to build a Streamlit app")
st.exception(RuntimeError("RuntimeError exception"))
8-Sidebar and container
We can additionally create a sidebar or a container on your page to organize your app. The hierarchy and arrangement of pages on your app can have a huge impact on your user experience. Organizing your content allows visitors to understand your site better and navigate it easier. It also helps them find what they are looking for faster and increases the likelihood that they will return.
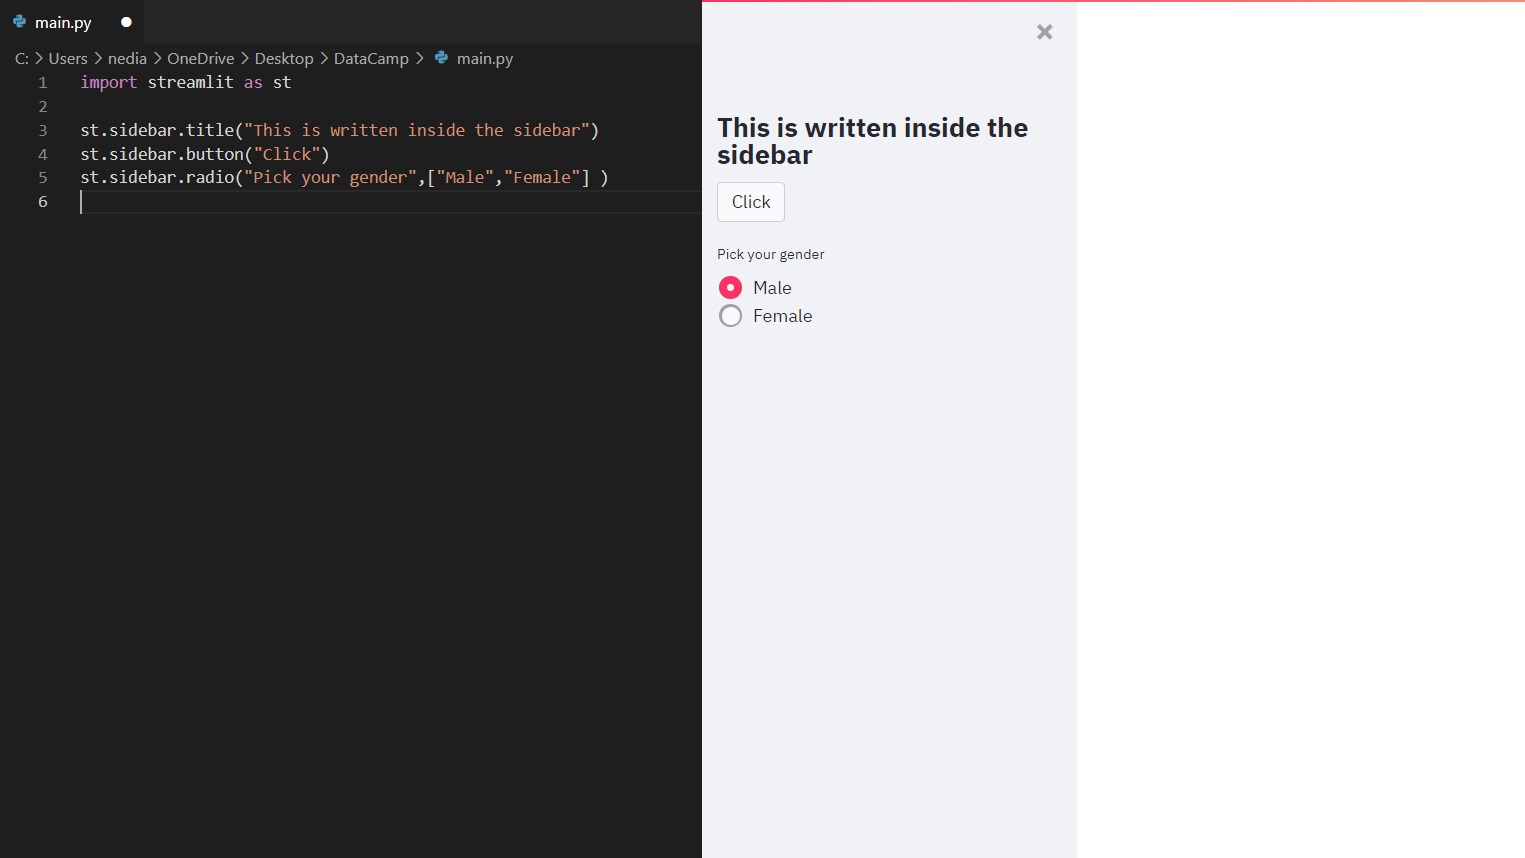
Passing an element to st.sidebar() will pin this element to the left, allowing users to focus on the content making your app more organized and easier to deal with.
import streamlit as st

st.sidebar.title("This is writter inside sidebar")
st.sidebar.button("Click")
st.sidebar.radio("Pick your gender",["Male","Female"])
Container
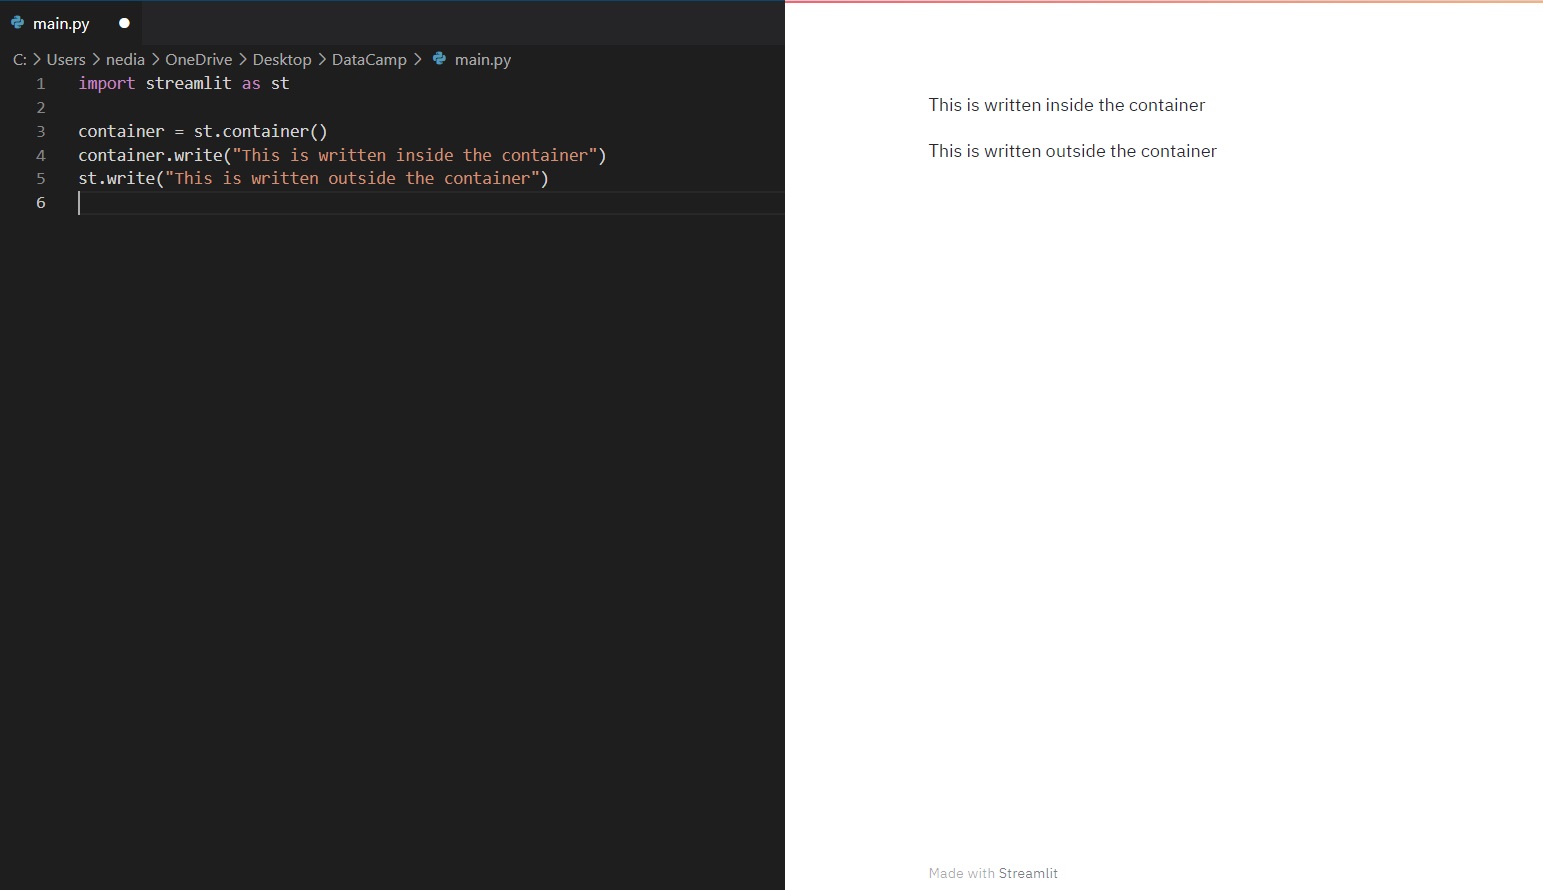
st.container() is employed to construct an invisible container where you can put elements creating a useful arrangement and hierarchy.
import streamlit as st

container = st.container()
container.write("This is written inside the container")
st.write("This is written outside the container")
import streamlit as st
import numpy as np

with st.container():
    st.write("This is inside the container")

    st.bar_chart(np.random.randn(50, 3))

st.write("This is outside the container")
.png)
9-Data Visualization
Data visualization simplifies telling stories by curating data into a more straightforward format, highlighting the trends and outliers. A good visualization conveys a narrative, removing the noise from data and emphasizing the valuable information. However, it is way more complicated than just dressing up a graph to make it look better or slapping on an infographic's "info" part.
Effective data visualization is a delicate balancing act between form and function. A plain graph could be too boring to draw attention or communicate a powerful message, whereas the most stunning visualization could fail to deliver the right idea. The data and visuals need to work together. However, combining great analysis with excellent storytelling is an art.
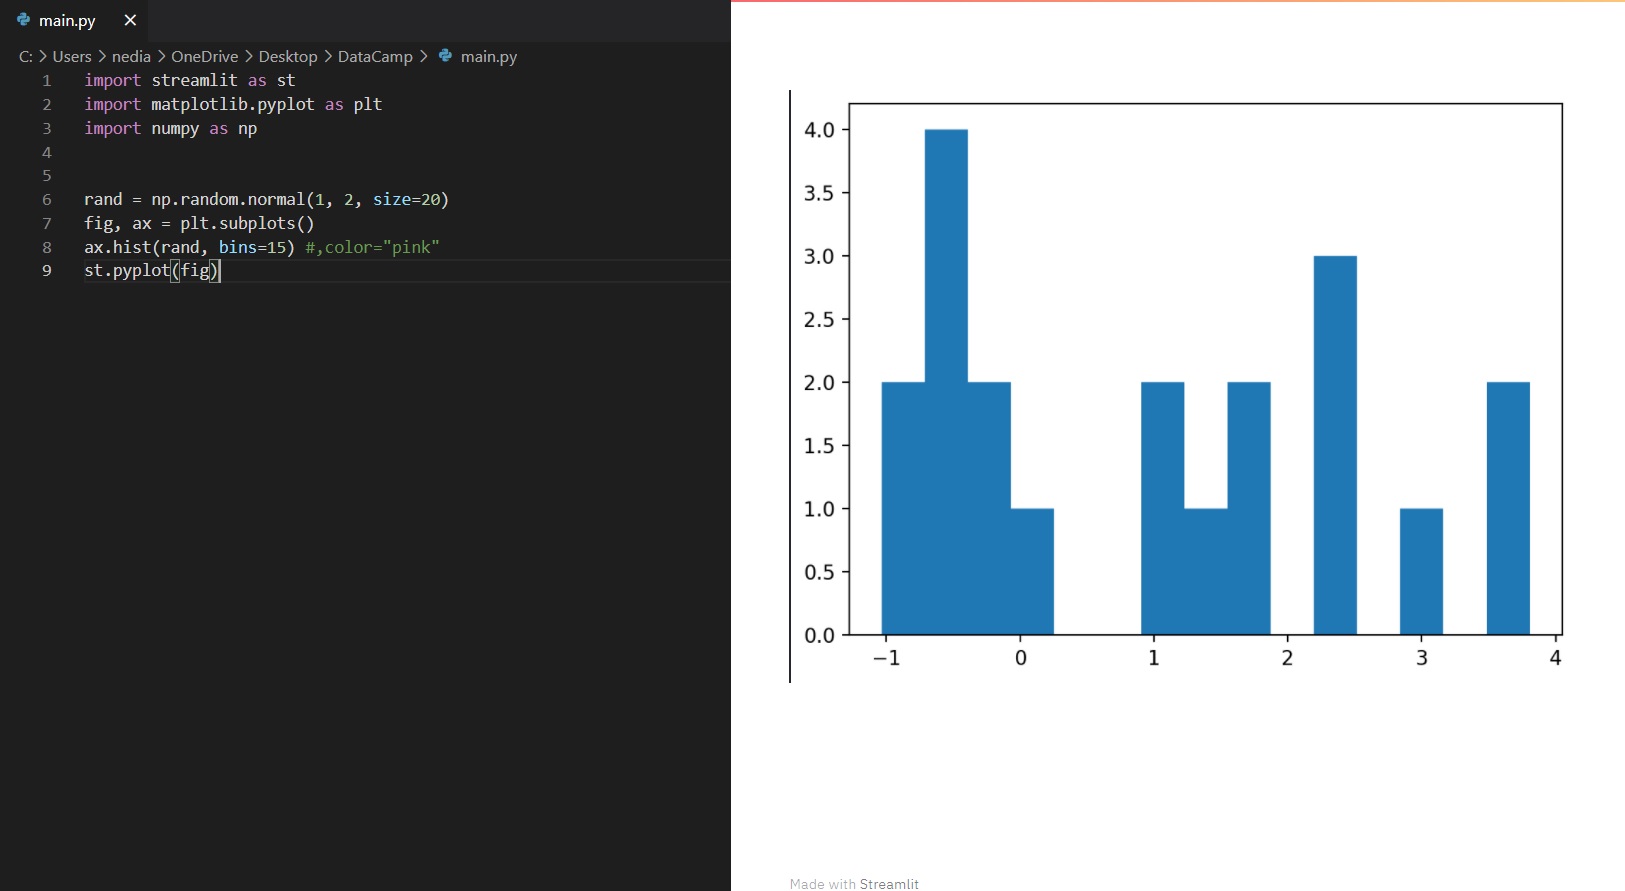
st.pyplot(): This function is used to display a matplotlib.pyplot figure.
import streamlit as st
import matplotlib.pyplot as plt
import numpy as np

rand = np.random.normal(1, 2, size=20)
fig, ax = plt.subplots()
ax.hist(rand, bins=15)
st.pyplot(fig)
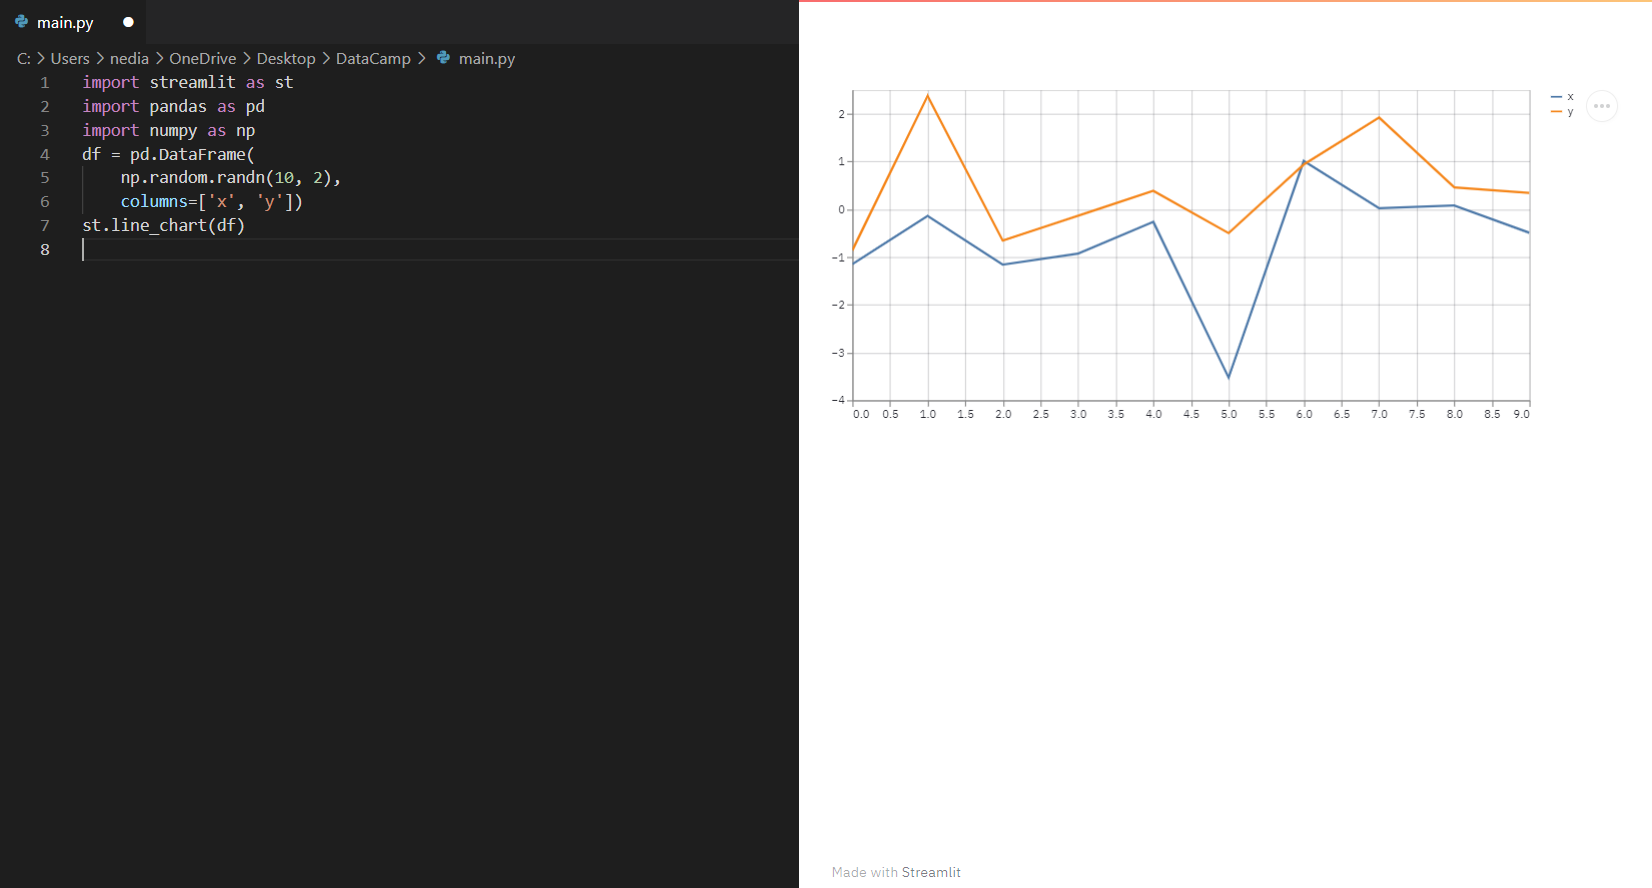
st.line_chart(): This function is utilized to show a line chart.
import streamlit as st
import pandas as pd
import numpy as np

df = pd.DataFrame(np.random.randn(10, 2), columns=['x', 'y'])
st.line_chart(df)
st.bar_chart(): This function is employed to exhibit a bar chart.
import streamlit as st
import pandas as pd
import numpy as np

df = pd.DataFrame(np.random.randn(10, 2), columns=['x', 'y'])
st.bar_chart(df)

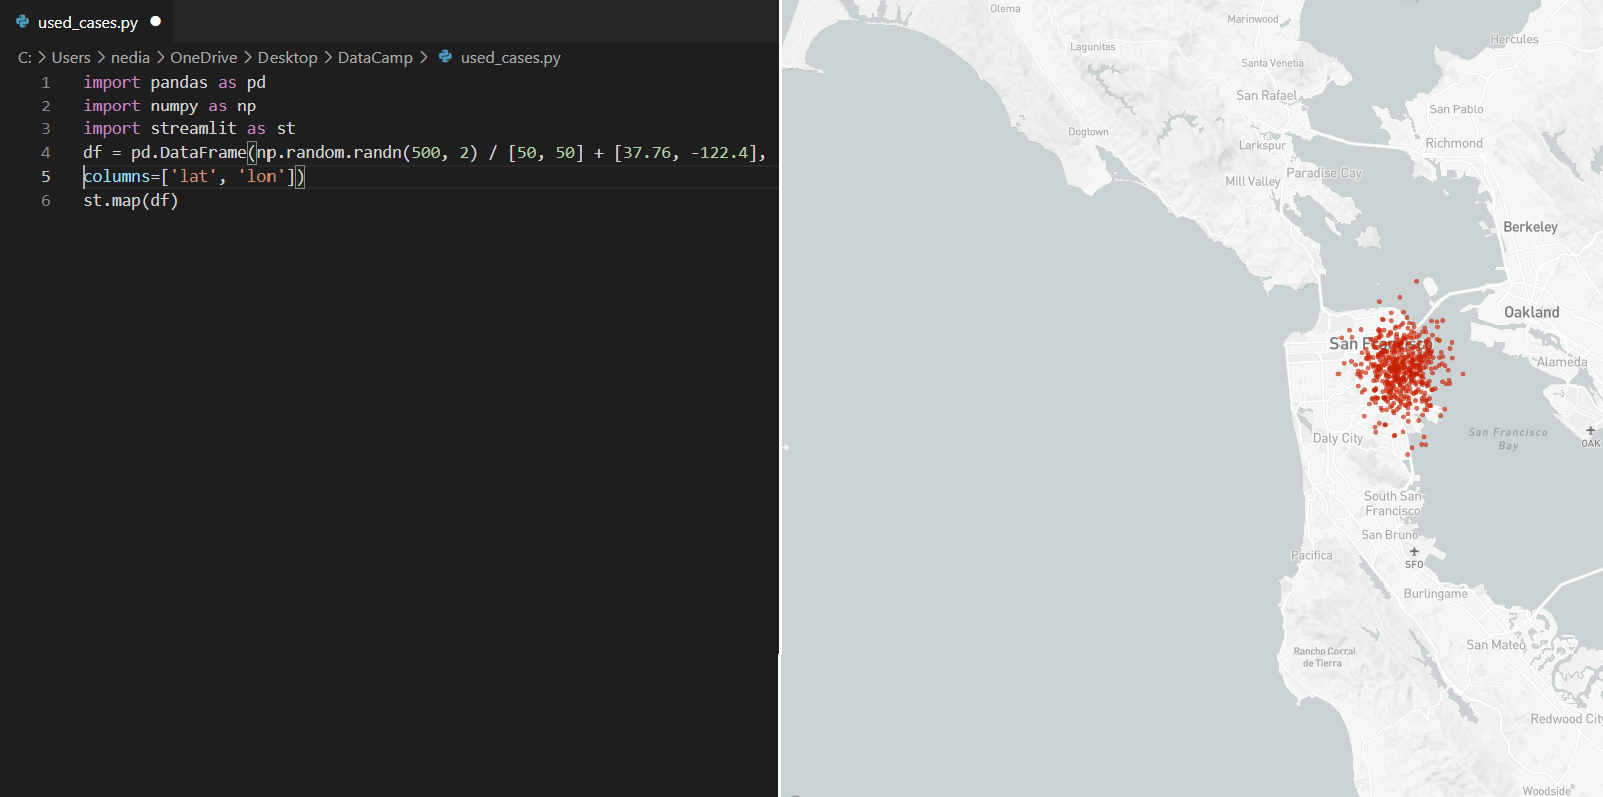
st.map(): This function displays maps in the app. However, it requires the values of latitude and longitude which cannot be null/NA.
import pandas as pd
import numpy as np
import streamlit as st

df = pd.DataFrame(
    np.random.randn(500, 2) / [50, 50] + [37.76, -122.4], columns=['lat', 'lon']
)
st.map(df)
10-Display a DataFrame
st.dataframe(): This command shows a DataFrame as an interactive table. It works with a variety of collection-like and DataFrame-like object types.
import streamlit as st
import pandas as pd
import numpy as np
df = pd.DataFrame(np.random.randn(50, 20), columns=("col %d" % i for i in range(20)))
st.dataframe(df)
.png)
You can also pass a Pandas Styler object to change the style of the rendered DataFrame:
import streamlit as st
import pandas as pd
import numpy as np

df = pd.DataFrame(np.random.randn(10, 20),
                  columns=("col %d" % i for i in range(20)))

st.dataframe(df.style.highlight_max(axis=0))
.png)
Summary
In this article, after introducing the Streamlit web framework, I demonstrated how to install Streamlit and run the application. We also explored some basic commands, widgets, and data visualization functionality.
In my next article, we will create a Streamlit web application to connect to the IRIS dataset and explore advanced concepts of Streamlit together.
Thanks
.png)